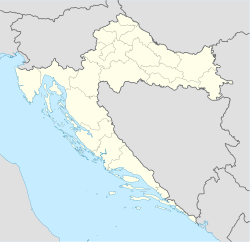
Mošćenička Draga (Italian: Draga di Moschiena) is municipality in Primorje-Gorski Kotar County, Croatia. It is situated southwest of Opatija under Mt. Učka. The settlement of Mošćenička Draga developed as a fishing port of the town of Mošćenice, and was first mentioned in 1436. [4]
Mošćenička Draga | |
|---|---|
Municipality | |
| Mošćenička Draga Municipality Općina Mošćenička Draga | |
 Mošćenička Draga | |
| Coordinates: 45°14′N 14°15′E / 45.233°N 14.250°E | |
| Country | Croatia |
| County | Primorje-Gorski Kotar County |
| Government | |
| • Mayor | Rikardo Staraj (PGS) |
| • City Council | 11 members[1] |
| Area | |
• Municipality | 46.7 km2 (18.0 sq mi) |
| • Urban | 1.5 km2 (0.6 sq mi) |
| Population (2021)[3] | |
• Municipality | 1,288 |
| • Density | 28/km2 (71/sq mi) |
| • Urban | 452 |
| • Urban density | 300/km2 (780/sq mi) |
| Time zone | UTC+1 (CET) |
| • Summer (DST) | UTC+2 (CEST) |
| Area code | 051 |
| Website | moscenicka-draga |
The centre of the municipality is the former fishing village of Mošćenička Draga which is today a tourist resort with two beaches, small marina and walking paths. Above Mošćenička Draga there is the hilltop town of Mošćenice.
Population
editIn the 2011 census, it had a total of 1,535 inhabitants, 90.7% of which were Croats.[5] The municipality consisted of the following settlements:[6]
- Brseč, population 129
- Golovik, population 84
- Grabrova, population 10
- Kalac, population 32
- Kraj, population 98
- Mala Učka, no population
- Martina, population 50
- Mošćenice, population 301
- Mošćenička Draga, population 585
- Obrš, population 14
- Sučići, population 45
- Sveta Jelena, population 93
- Sveti Anton, population 8
- Zagore, population 86
Gallery
edit-
Port
-
"Marina" Hotel
-
Beach
References
edit- ^ "Konačni rezultati" (PDF) (in Croatian). Retrieved 29 May 2017.
- ^ Register of spatial units of the State Geodetic Administration of the Republic of Croatia. Wikidata Q119585703.
- ^ "Population by Age and Sex, by Settlements" (xlsx). Census of Population, Households and Dwellings in 2021. Zagreb: Croatian Bureau of Statistics. 2022.
- ^ "Mošćenička Draga | Turistička zajednica". www.tz-moscenicka.hr. Retrieved 2023-05-25.
- ^ "Population by Ethnicity, by Towns/Municipalities, 2011 Census: County of Primorje-Gorski kotar". Census of Population, Households and Dwellings 2011. Zagreb: Croatian Bureau of Statistics. December 2012.
- ^ "Population by Age and Sex, by Settlements, 2011 Census: County of Primorje-Gorski kotar". Census of Population, Households and Dwellings 2011. Zagreb: Croatian Bureau of Statistics. December 2012.
External links
editWikimedia Commons has media related to Mošćenička Draga.
Climate types
edit| Climate data for Mošćenička Draga (Mošćenička Draga 2015–2020, sunshine 2015–2020, extremes 1949–present) | |||||||||||||
|---|---|---|---|---|---|---|---|---|---|---|---|---|---|
| Month | Jan | Feb | Mar | Apr | May | Jun | Jul | Aug | Sep | Oct | Nov | Dec | Year |
| Record high °C (°F) | 20.8 (69.4) |
22.9 (73.2) |
26.7 (80.1) |
29.4 (84.9) |
34.2 (93.6) |
35.6 (96.1) |
39.3 (102.7) |
40.2 (104.4) |
34.9 (94.8) |
27.8 (82.0) |
24.2 (75.6) |
21.7 (71.1) |
40.2 (104.4) |
| Mean daily maximum °C (°F) | 11.7 (53.1) |
14.9 (58.8) |
16.6 (61.9) |
18.7 (65.7) |
21.3 (70.3) |
25.0 (77.0) |
29.8 (85.6) |
30.5 (86.9) |
26.3 (79.3) |
20.2 (68.4) |
16.2 (61.2) |
12.9 (55.2) |
20.3 (68.6) |
| Daily mean °C (°F) | 8.8 (47.8) |
13.0 (55.4) |
16.2 (61.2) |
19.6 (67.3) |
21.5 (70.7) |
22.3 (72.1) |
22.7 (72.9) |
22.0 (71.6) |
17.1 (62.8) |
11.4 (52.5) |
10.7 (51.3) |
9.6 (49.3) |
16.2 (61.2) |
| Mean daily minimum °C (°F) | 4.0 (39.2) |
3.8 (38.8) |
4.9 (40.8) |
7.6 (45.7) |
11.8 (53.2) |
15.8 (60.4) |
19.8 (67.6) |
20.4 (68.7) |
16.0 (60.8) |
13.6 (56.5) |
9.1 (48.4) |
5.3 (41.5) |
6.6 (43.9) |
| Record low °C (°F) | −10.6 (12.9) |
−9.6 (14.7) |
−6.9 (19.6) |
−1.2 (29.8) |
2.4 (36.3) |
7.2 (45.0) |
8.3 (46.9) |
6.5 (43.7) |
4.6 (40.3) |
−1.9 (28.6) |
−4.4 (24.1) |
−9.9 (14.2) |
−10.6 (12.9) |
| Average precipitation mm (inches) | 158.5 (6.24) |
254.9 (10.04) |
175.7 (6.92) |
87.9 (3.46) |
90.2 (3.55) |
45.3 (1.78) |
24.5 (0.96) |
37.4 (1.47) |
70.4 (2.77) |
119.0 (4.69) |
289.2 (11.39) |
276.9 (10.90) |
1,629.9 (64.17) |
| Average rainy days (≥ 0.2 mm) | 19.7 | 18.9 | 16.9 | 14.5 | 9.2 | 6.9 | 3.8 | 6.4 | 11.3 | 15.9 | 19.9 | 18.5 | 161.9 |
| Mean monthly sunshine hours | 77.2 | 93.4 | 150.0 | 184.1 | 248.2 | 296.7 | 327.2 | 286.8 | 180.3 | 86.7 | 68.1 | 70.2 | 2,068.9 |
| Source 1: Weatheronline.de[1] | |||||||||||||
| Source 2: Meteociel.fr[2] | |||||||||||||
- ^ "Freiburg/Breisgau historic weather averages" (in German). weatheronline.de. Retrieved 22 June 2014.
- ^ "Freiburg/Breisgau historic extremes" (in French). Meteociel.fr. Retrieved 6 November 2015.

